Summary: Driver capacity is exiting the for-hire market more slowly than many observers expected. With a growing anticipation of a recovery soon, the question now is whether carriers will be even more reluctant to downsize or give up the ghost. Note: This commentary is from the July 2024 FTR State of Freight Insights.
When we last addressed driver capacity in February, we concluded that aside from Yellow Corporation’s failure, which really only affected LTL, capacity was exiting the for-hire market slowly.
The apparent dynamic in February was that very small operations were exiting the market in droves but that employment at larger carriers was still higher than seemed likely given weakness in the truck freight market.
We identified possible signs of an accelerated decline in the driver population, including a drop in the number of pre-employment queries of the Federal Motor Carrier Safety Administration (FMCSA) drug and alcohol clearinghouse for drivers holding commercial driver’s licenses (CDLs). However, the latest data available then was for December, which is a weak month for driver hiring.
Five months later, signs seem to point more to a slower, not faster, exit of driver capacity. It feels something like a Catch 22: Carriers want capacity to exit to strengthen the market, but a stronger market – or at least expectations of one – could be discouraging the exit of capacity.
Slowing Exits of Carriers
In February, the market was coming off a fourth quarter of 2023 that had seen a record 7,200 for-hire trucking operations exit on a net basis followed by a January that saw the largest monthly net decrease in the carrier population ever.
As we suggested in February, if we were going solely by carrier failures, we would have assumed that a rapid rightsizing of the industry was underway. Even then, however, we noted that small carrier failures would have to continue and probably accelerate in order to make any material difference.

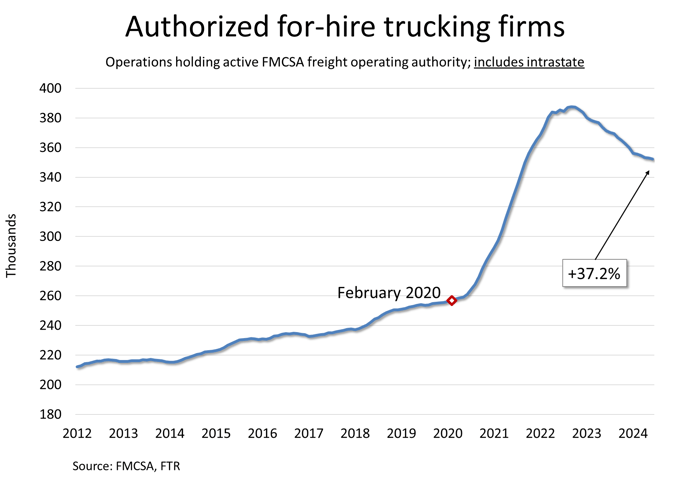
The for-hire population peaked in September 2022 at more than 387,000 carriers, which was around 130,000 more carriers than in February 2020. Those figures include intrastate operations, which account for about 20% of authorities, according to our analysis. As of January of this year, the market still had nearly 99,000 more for-hire carriers holding active authority than it did in February 2020.
How much change have we seen since January? Very little. Through June, the market still has more than 95,000 more carriers than it had before the pandemic. That’s a 37% net increase in the carrier population after more than 18 months of carriers exiting the market month after month. (Well, mostly. March 2023 and March 2024 saw miniscule net increases in the carrier population.)
Obviously, we do not need to see all of those added carriers fail to return balance to the truck freight market, but at a rate of fewer than 1,000 carriers exiting the market on a net basis each month, a falling carrier population alone simply is not changing the capacity situation meaningfully.

As we have acknowledged before, the vast majority of carriers are very small, averaging fewer than 2 power units. However, the sheer scope of the increase in carriers since the beginning of the pandemic means that the residual increase in the carrier population accounts for lots of capacity.
Later in this analysis we will address capacity changes by fleet size. Most of the lingering capacity increase among the smallest carriers is due to new entry as opposed to organic growth.
A Steady but Shallow Decline in Jobs
Changes in the carrier population represent valuable signposts for how capacity in the market is shifting, but those signals are insufficient. For example, the number of carriers losing authority began to rise sharply in the second quarter of 2022 but so did payroll employment in trucking.
Driver capacity wasn’t falling in 2022Q2. It was just shifting back to larger carriers from small operations that had experienced a sudden reversal of fortune when spot rates began to fall sharply and diesel prices skyrocketed to record highs.
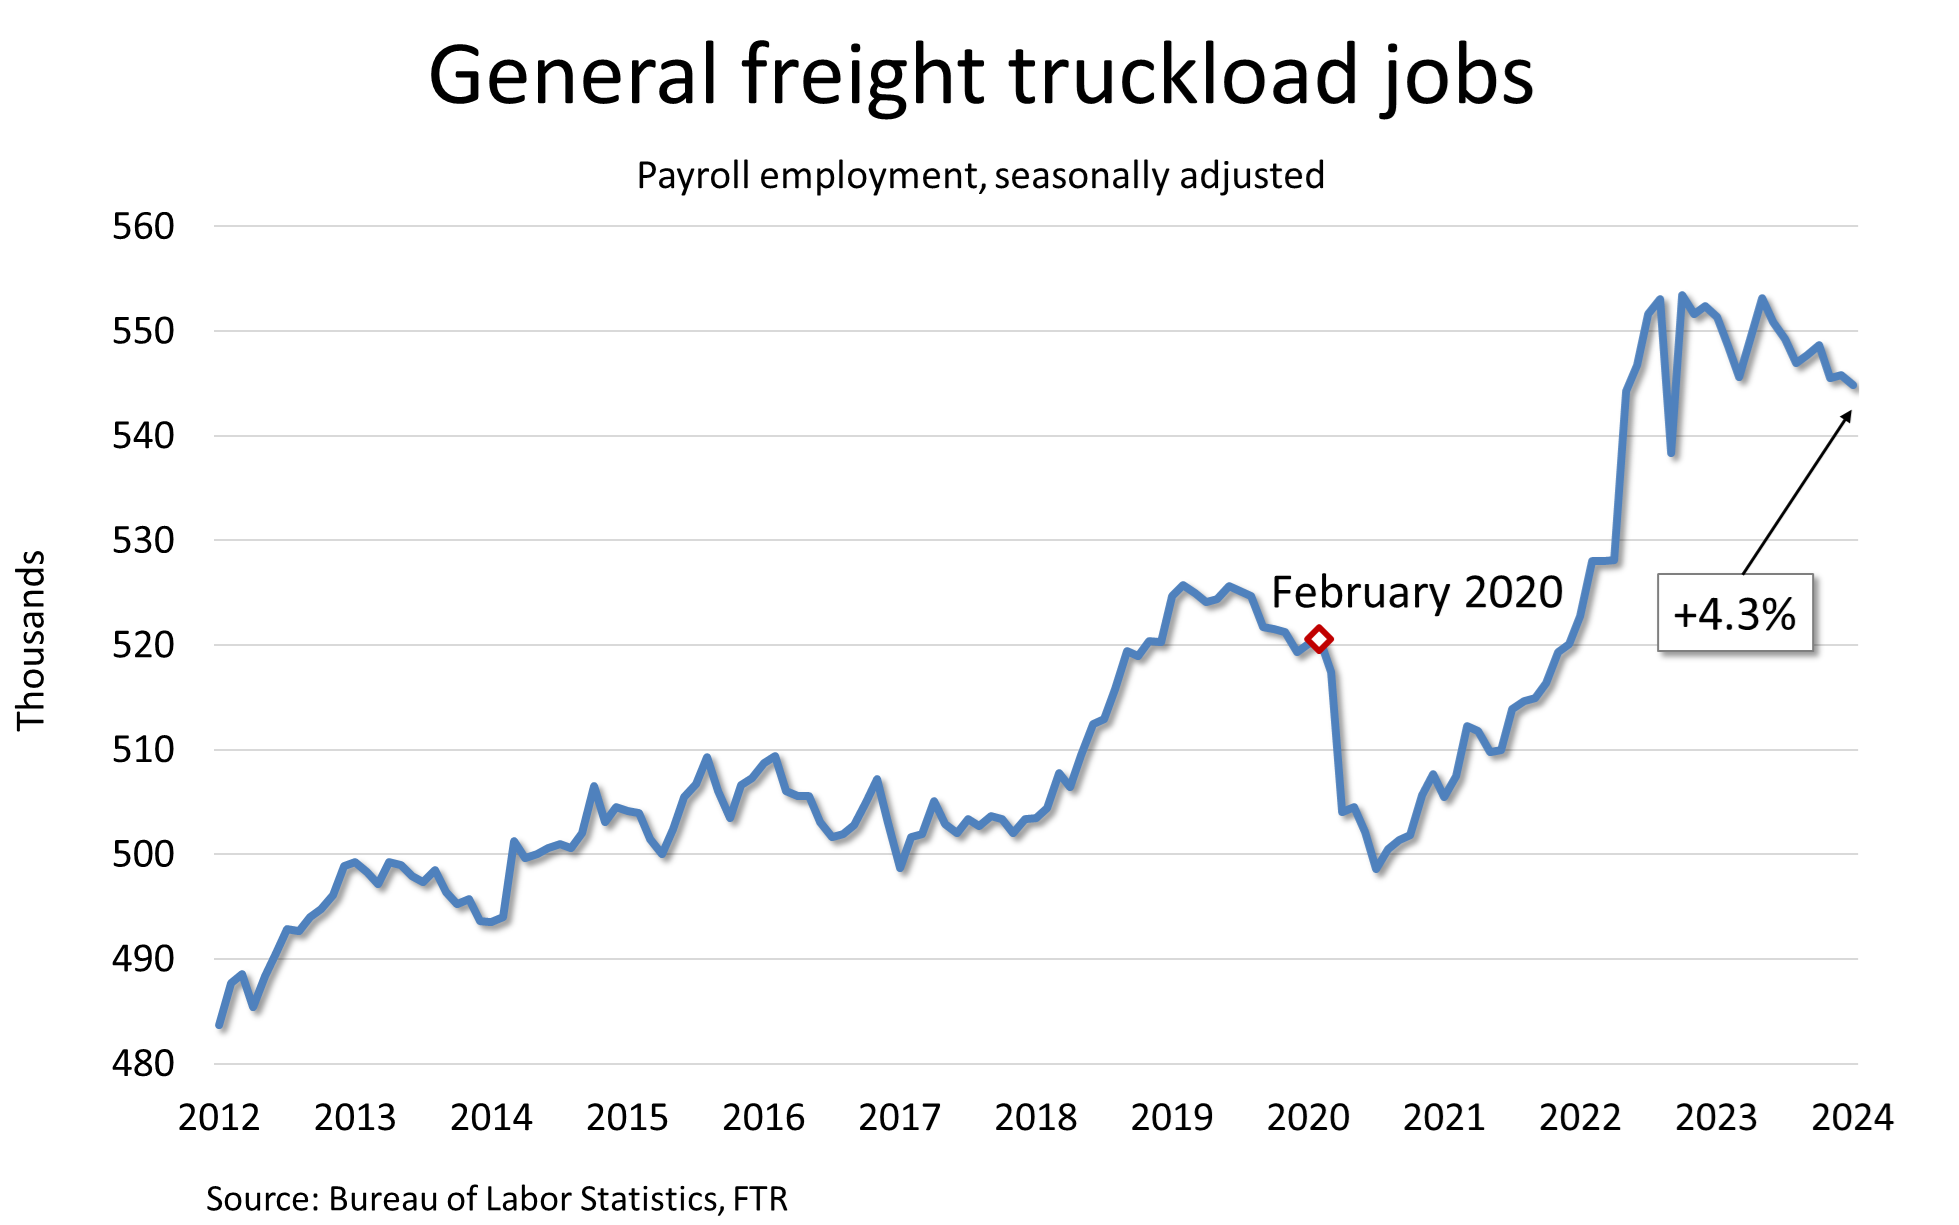
In the general freight truckload segment – the trucking sector most affected by excess capacity – payroll employment surged 4.8% from April to October 2022, which stands as the all-time high, according to Bureau of Labor Statistics figures. In fact, almost all of that surge had occurred by August. The BLS estimate has September employment dropping sharply and then immediately rebounding to the record in October.
By April 2022, truckload employment was already 1.5% above the pre-pandemic level. By October, the sector had 6.3% more payroll jobs and 50.8% more for-hire carriers than it had in February 2020.
Truckload employment was volatile in late 2022 and early 2023, but by May 2023 it was back to essentially the same level as October 2022. Since then, payroll jobs have fallen steadily.
Still, as with the carrier population, the market has seen only modest change over the past five months. Payroll employment in truckload was 4.9% higher in December 2023 (the latest data available in February) than in February 2020 while employment was 4.3% higher in May. Since May 2023, payroll jobs are down 10,400, or 1.9%.
We must acknowledge that payroll jobs and drivers are not the same, although as we have discussed frequently, driver jobs likely account for most of the month-to-month changes, especially in truckload.
So capacity apparently is exiting the truckload market, but it seems to be doing so more slowly now than five months ago or a year ago.

Fool me twice?
As noted earlier, back in February we pointed to the low level of pre-employment clearinghouse queries in December as a possible sign of declining driver payrolls – even as we noted that December usually is a weak month for driver hiring.

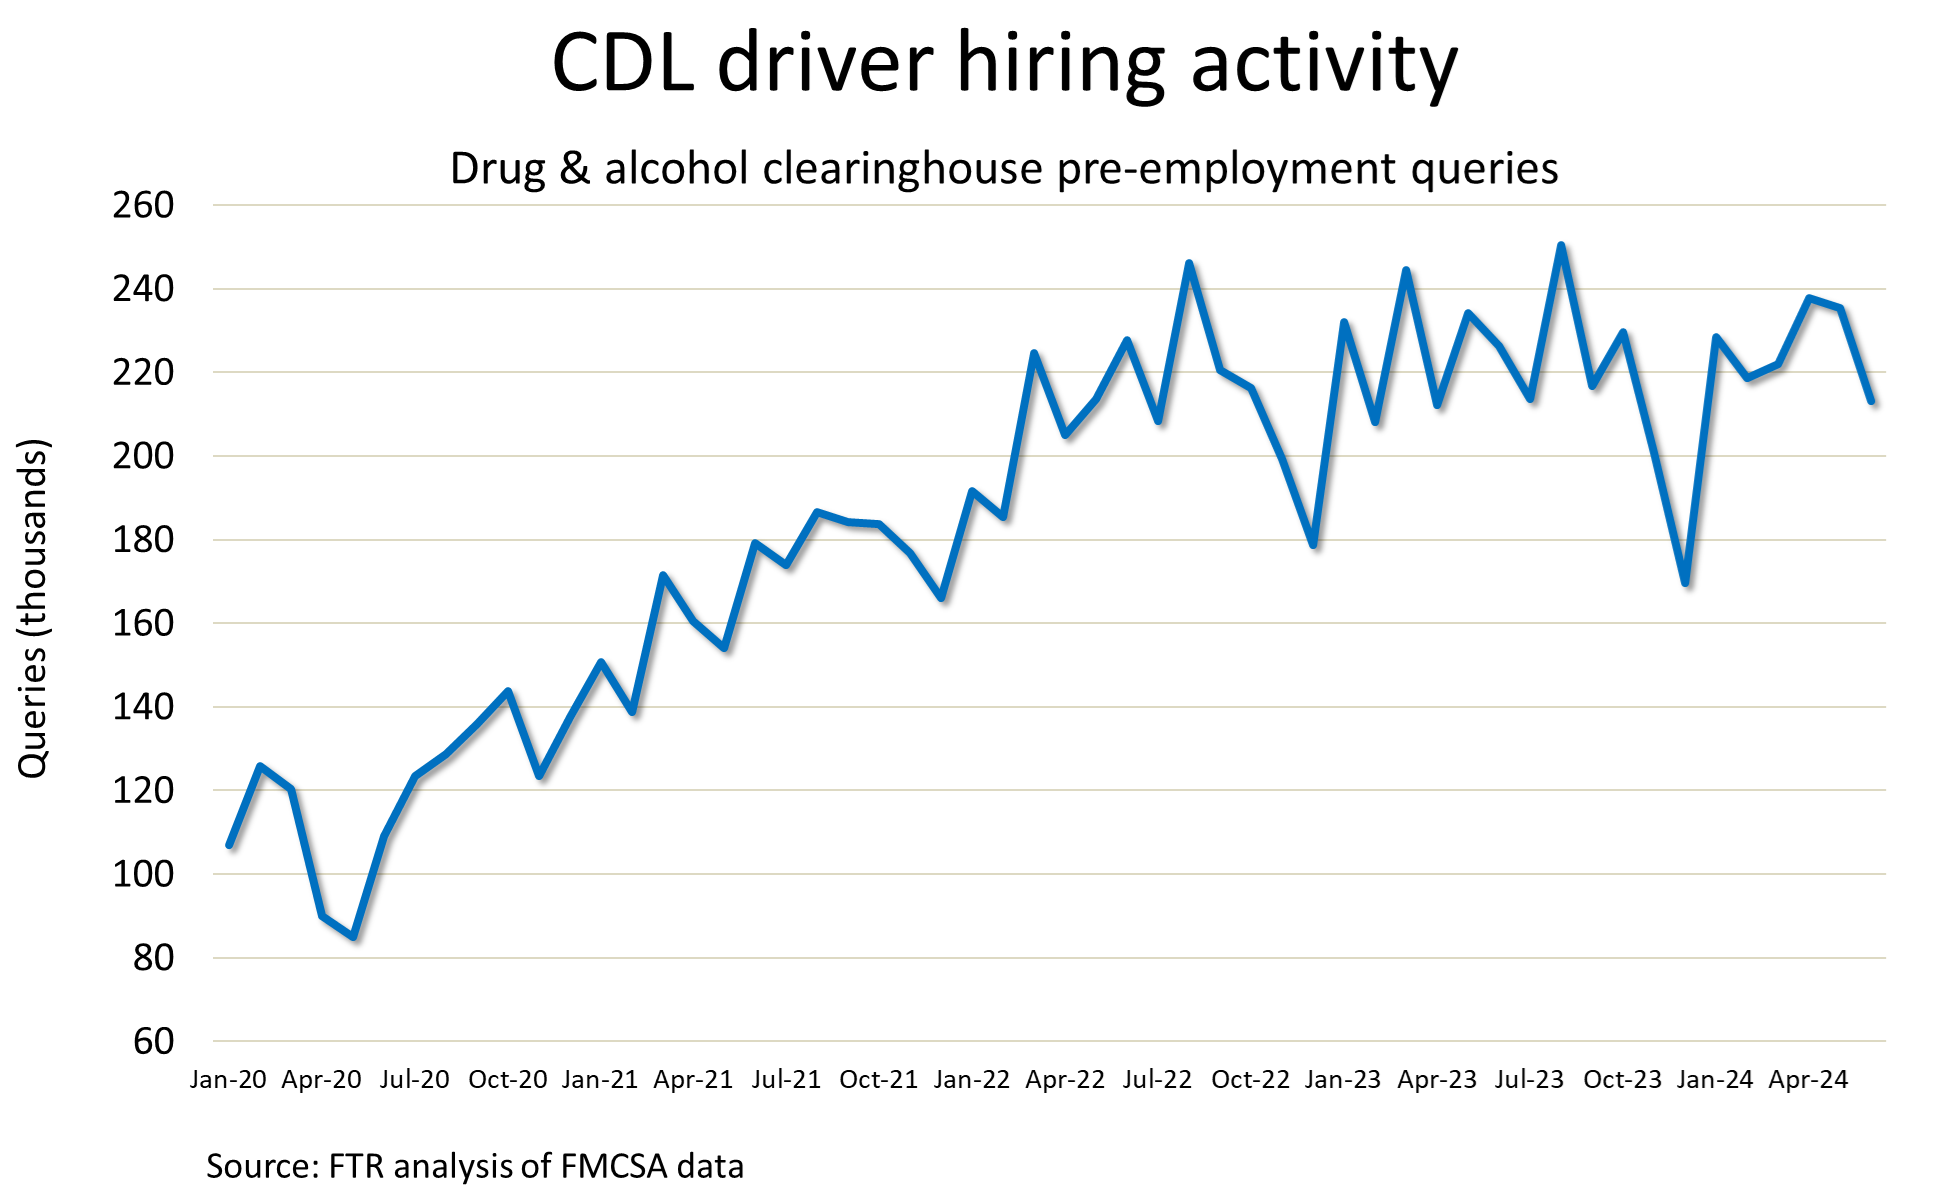
The final data for this commentary arrived in late July when FMCSA released its June 2024 report on clearinghouse data, inducing just a bit of déjà vu. Like December, the latest data showed a notable m/m decline. Unlike December’s figure, though, the June level of queries was still within the general range of the past couple of years, albeit at the lower end of that range.
Still, in a climate during which everyone is looking for signals we will parse the data a bit more. Queries fell 9.4% m/m in June for the sharpest drop this year, and they were down 5.8% y/y. This dataset goes back only to January 2020, but it is still notable that the only month to see a bigger y/y deficit than June was March of this year when queries were down 9.2%. However, some of that weakness is attributed to how strong March 2023 was. The June 2023 level was more ho-hum.
Also, queries in June were at their lowest level since April 2023 except for the seasonally weak months of November and December.
The clear snag in this analysis, though, is the data’s variability. As the chart shows, queries are quite volatile as the data is not seasonally adjusted. Unadjusted payroll jobs numbers also are quite volatile, but we always look at that data on a seasonally adjusted basis. With only a few years of data and big distortions for the first couple of years, seasonal adjustment for queries is not yet feasible.
Moreover, changes in pre-employment queries do not necessarily correlate with changes in employment levels. Driver turnover surely accounts for most queries, so rising or falling turnover rates likely are as significant a factor as carriers’ need to increase or decrease their hiring activity in order to maintain at least a static level of seated trucks.
Another drawback in linking queries to for-hire capacity is that all motor carriers – private and for- (Continued from page 2) hire – must query the clearinghouse when hiring drivers required to hold CDLs.
All these limitations mean that we cannot rely too strongly on pre-employment queries as a proxy for changes in for-hire driver capacity.
Netting Out Capacity Shifts
Carrier entries and exits, payroll employment, and pre-employment queries are just clues – tea leaves floating in the cup that is the truck freight market. However, they are near-real-time indicators. Much like data on the spot market, these data points individually are insufficient for drawing conclusions about the broader truck freight market, but they are relatively high-frequency insights.
Conversely, we do have a source on the driver population that is more precise and comprehensive – at least as it applies to interstate operations. The major problem is that this data lags because it is far from a clean snapshot of a point in time.
FMCSA requires interstate motor carriers, both for hire and private, to update their registration profiles at least once every two years, including their numbers of drivers, power units, trailers, and so on. Fortunately, many carriers update their data more frequently, often in conjunction with insurance renewals or other tasks, but a lag is unavoidable. (For more about the data, see page 4.)
Another limitation arises if you consider only a couple of snapshots in time. If we looked only at data today versus, say, March 2020 we might have a sense of the change over that period, but we would not know in what direction the data was trending. Multiple snapshots help provide a richer picture.
What does the data indicate? In essence, it confirms the broad dynamic implied by how the carrier population and payroll employment have changed. The surge in for-hire driver capacity starting in late 2020 and peaking, probably, around the fall of 2022, was due mostly to an unprecedented surge in the number of new carriers entering the market.
Meanwhile, those new carriers came from driver payrolls of larger truckload operations, which meant that by mid-2022, for-hire carriers with more than 100 trucks had managed only to get back to employment levels they had immediately before the pandemic. Since mid-2022, the dynamic has reversed for reasons already discussed. The small end of the market has given up its peak gains through failures while the upper end of the market has picked up much of that capacity.

The number of drivers in the market has declined only 3 percentage points over the past two years. Again, the data lag means that the actual calculations of capacity surely are off the mark, but the change over time should be more accurate.
Interestingly, for-hire carriers with more than 100 trucks have held steady over the past year only because of Yellow’s failure. If Yellow were still in the market, driver capacity for that segment arguably would be up 4% rather than 1.8%. We say “arguably” because we cannot know whether Yellow (Continued from page 3) would have held on to its full work force or whether market weakness perpetuated by Yellow’s survival might have yielded capacity cuts elsewhere in LTL.
FTR’s Modeled Assessment
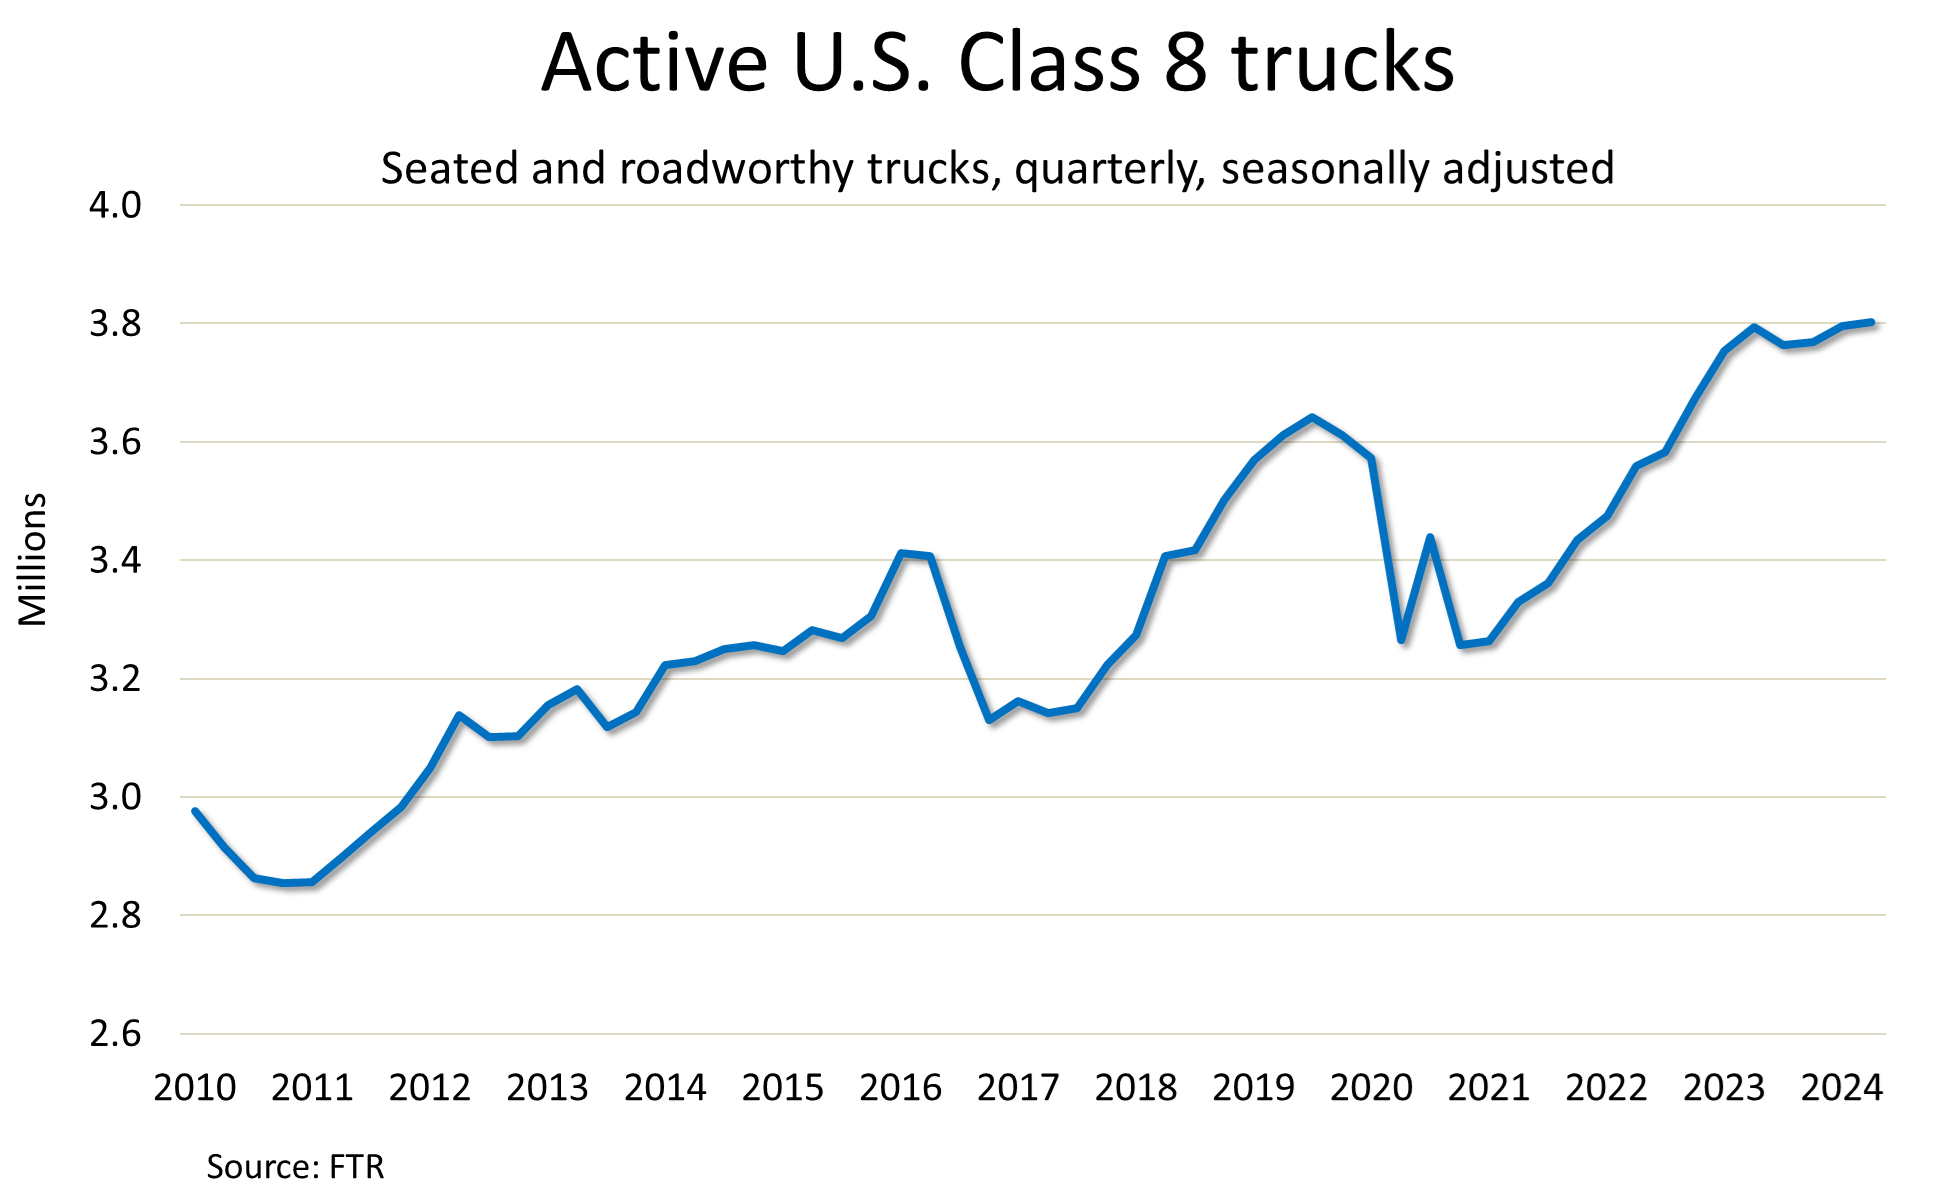
Within our Freight•cast model, we estimate active Class 8 trucks, which is basically the same as saying the number of Class 8 drivers. While this is a modeled estimate, as discussed earlier, no other single source is proven to be more reliable.
Our estimate suggests that overall driver capacity is basically at a record level, but this calculation does not consider solely for-hire operations or, indeed, just over-the-road operations. It’s an estimate of capacity for the entire truck freight market. Even looking at this broader dataset, the driver force largely stopped growing in 2023Q3.

Notes on the Data
Much of this commentary is based on FTR’s analysis of data that for-hire interstate motor carriers submit periodically to the Federal Motor Carrier Safety Administration. We exclude carriers that did not hold operating authority during the periods assessed. We also exclude private fleets that hold authority and the major parcel carriers.
Interstate carriers must update their profile data every two years and do so on a staggered schedule. Many carriers update their data more often than every two years, but FMCSA registration data is sluggish in that it generally will not capture changes as quickly as they happen except in the case of newly authorized carriers or those failing. Therefore, we cannot estimate capacity precisely. By revisiting the data over time, however, we can build a more reliable view.
FMCSA’s Motor Carrier Management Information System (MCMIS) also includes data on intrastate motor carriers that hold US DOT numbers. However, those carriers are not required to update their driver or truck and trailer fleet totals after their initial submissions and most do not. Therefore, FTR considers FMCSA’s intrastate data to be unreliable.
FTR’s analysis of net changes in the carrier population is based on a separate FMCSA dataset that tracks carrier licensing and insurance. FTR uses this data to calculate the number of newly authorized property carriers and the number of revocations of motor property authority. We subtract from the number of revocations the number of reinstatements of authority during the same period. The net change in the carrier population is the number of new carriers minus the number of revocations net of reinstatements.
We have chosen to focus on for-hire capacity for several reasons. Private fleet capacity usually is limited to specific tasks and does not replace the need for for-hire operations for portions of inbound and outbound logistics. Moreover, private fleets are far more diverse in applications, including many large operations that are not even involved in transporting freight. To the extent we address private fleets, we generally limit the analysis solely to those entities that operate tractors as opposed to straight trucks.
Interested in Learning More?
If you like this article, then check out FTR’s complimentary industry resources at ftrintel.com/state-of-freight-today!
Like this kind of content?
As a member of the Wnbaz, stay on top of emerging trends and business issues impacting transportation and logistics; learn the importance of gender diversity in the workplace and the need for more women drivers; and see best practices in encouraging the employment of women in the trucking industry. Join today! Learn More


